Commentary on Economic Instability
Victor Kasper, May 16, 2001
The following descriptions and comments on instability I will develop into a longer essay as I have more time.
The charts have
were constructed by me. The free slide script was provided by
Website Abstraction
I will eventually have scenes from the Great Depression above. These are awaiting copyright permission. For now charts of economic activity are provided.

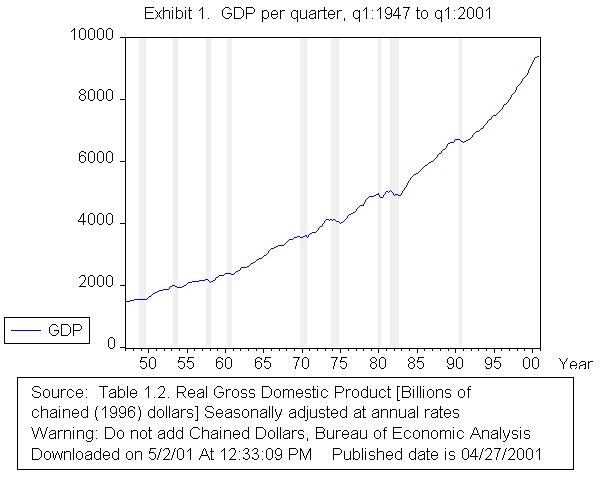
U.S. GDP/quarter ($ billions)
Although official recessions have not been as frequent in the last 15 years, capitalism over the last 150 years has been characterized by instability. Instability and its severity are not always reflected in the official recessions. Such phenomena as downsizing, unemployment and falling or stagnant income affect many in times when the economy is not considered to be in a recession. In the short run (2 to 5 years) this the official measured instability is referred to as the business cycle. (1) In addition, some groups and regions find themselves more severely affected than others. The unemployment rate among people of color is usually twice as high as that of whites. One reflection of macroeconomic instability is the rate of change in GDP on an annual basis. GDP is tracked over time in the graph above. A downturn in the economy is referred to as a recession. This is considered a downturn of economic activity for more than six months. (Colander, p. 139, 1995) See the features of recessions at the National Bureau of Economic Research (NBER) site. Robert E. Hall provides a more in depth discussion of how the Bureau's business cycle dating committee comes up with their determination of whether a recession has begun. (Hall, NBER site.) Hall indicates that "Although industrial production and employment are the two most important measures considered by the NBER in developing its businness cycle chronology, there is no fixed rule about which other meaures contribute information to the process."(Hall, NBER site.) There have been ten recessions since the end of World War II. Hall has noted that "The NBER's Business Cycle Dating Committee does not determine the start or end of a recession until we have at least six months of data beyond that date, and often even more time is required to make the determination." (Hall, May 4, 2001, NBER site.) For more recent data on GDP go the the Bureau of Economic Analysis (BEA) site for their news releases. Nine of the ten post World War II recessions (measured from peak to trough of the business cycle) are shaded in grey in Exhibit 1 above. The BEA indicates (current estimates March 17, 2001) that the GDP growth rates for the U.S. (on a annual basis) for the last three quarters of 2000 were 5.6 %, 2.2 % and 1.1 %. The more recent release (March 29, 2001) of the BEA indicated that final estimate for the fourth quarter of 2000 was 1.0 %. (BEA, March 29, 2001) The prelimary growth estimate for the first quarter of this year was 2 percent. This will place less pressure on the FED to lower interest rates.
Note here the data time lag. The preliminary estimates were released by the BEA at the end of February for the fourth quarter of 2000. This represents a 2 month data lag. The final estimate based on more complete information at the end of March represents a three month data lag. The BEA actually puts out three esitmates one called an advanced estimate, the second is the preliminary estimate. The last is the final estimate. The release of the first quarter real GDP growth took place on April 27, 2001 about month after the quarter.
During a recession the unemployment rate rises, both the measured rate and the unmeasured unemployed. The unmeasured unemployed and/or underemployment includes discouraged workers, many part time workers and people not making best use of their skills. The recession is a period of both economic and social distress. Although separating the two types for many does not make much sense since they are closely related, hence, the use of the term socio-economic. In the graph above, the back to back recessions of the early eighties and 1990-91 can be discerned. The U.S. economy is currently in a period of greater uncertainty and a possible downturn. The data lags are such that it is only after about six months that we have some verification that we have entered a downturn. See the announcement dates of past recessions at the NBER site.
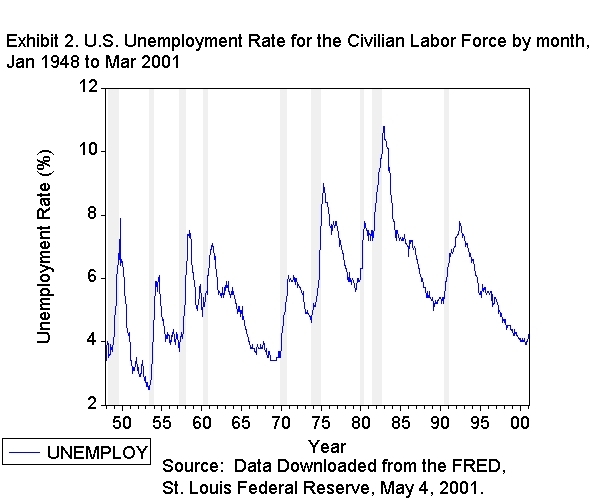
During the depth of a recession the unemployment rate tends to rise to higher levels. The recessions in Exhibit 2 above are shaded in grey. You will notice the rise in the unemployment rate in the graph above during the 81-82 recession and the rise in the unemployment rate of the 90-91 recession. The recent past has been unusual in that we have not experienced the semi-official definition of a recession since 90-91. The current softening of the economy has seen a rise in the unemployment rate from 3.9 % in October 2000 to 4.2 % in February 2001. See the recent estimates of the Bureau of Labor Statistics (Seasonally adjusted rate. March 18, 2001. This rate rose to 4.3 % in March 2001 and 4.5 % in April. There was a loss of 223,000 in payroll employment in April. (BLS news Release, May 4, 2001.) This means that 6.1 million people were officially unemployed in March and 6.4 million were offically unemployed in April. The level of unemployment increased by 300,000 in April. This is an indication that a recession is still a real possibility contrary to the more postive picture portrayed by the recent growth rate in GDP. Hall in his May 4th memo notes that "In summary, the data normally considered by the committee indicate the possibility that a recession began recently, but the economy has not declined enough to merit a meeting of the ecommmittee or the determination of a peak date." (Hall, May 4, 2001, NBER site.) It has to be remembered that official unemployment excludes discouraged workers, the involuntarily unemployed and the rising prison population. One source indicated that the adjustment to the official rate for the involuntarily unemployed and discouraged workers would have more than doubled the official rate that existed in January 2000. (Dollars Sense Collective, REAL WORLD MACRO, page 13.) McConnell and Brue indicated that in 1997, 18.9 million people were part-time workers by choice and an additional 2.8 million were part time by force of circumstances. The category of discouraged workers will vary over the business cycle, rising in a downturn. An estimate for 1991 was 1.25 million. (McConnell and Brue, pps. 155-156, 1999.)
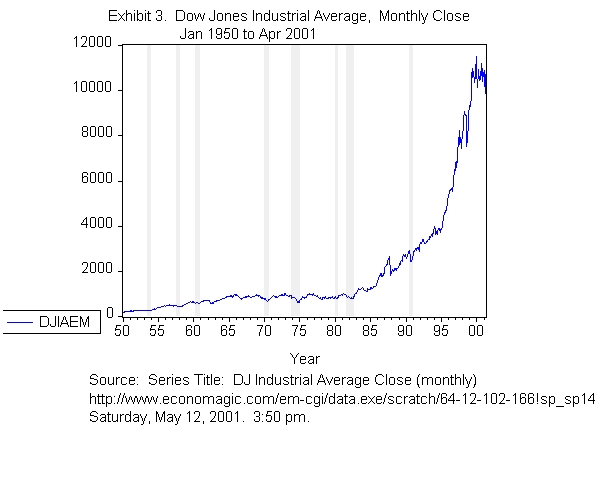
The movement in the finanical markets also exhibits instability and this instability is related to changes in real economic activity (that is the production of goods and services not merely the exchange of ownership certificates over existing assets). The recessions in Exhibit 3 above are shaded in grey. The stock market crash of 1987 can be distinguished on the graph above. There are various theories that relate the financial markets to the real economy. Some of these I will comment on later. The Federal Reserve has been recently concerned with signs of a slowing economy. See the recent testimony of Alan Greenspan. The stock market has not been doing well for the last year. After a rather substantial rise from the early nineties through about a year ago, it has stumbled over the last year. This is illustrated in Exhibit 3. above. This has coincided with a softening of the real economy. Between March and April of 2001, the stock market has been erratic, the Dow fell below 10,000 for a time. The FOMC response to both the signs of economic weakness and the stock market behaviour was not quite what the financial market had desired. See the March 20, Federal Open Market Committee (FOMC) press release. The May 15th release from the FOMC recognizes that the economy is still weak as indicated by the falling employment numbers. They have responded by lowering the Federal Funds target to 4 percent and the discount rate to 3.5 percent.
The movement in the price level results in inflation. This is another aspect of economic instability. The best measure of the overall price level for the economy as a whole is the GDP implicit price deflator. This is tracked by the Bureau of Economic Analysis. (BEA) Measures of the Price level.
| | Top of page | Page Guide | Office | Citations for Art and Music | Schedule| Development lab | |
![]()
Copyright © 1999 Victor Kasper, Jr. All rights reserved. This page was created by Victor Kasper, Jr. and is maintained by Victor Kasper. Last modified on Novermber 11, 2000. This page was created in November 1999. The individual pieces of art are from copyright sources noted above. These individual items must be obtained from the original source sites that are noted above. The copyright material for Victor Kasper refers to the text of the article or essay, any charts or graphs and the combination and arrangement of this material. If the article or essay is jointly written the copyright is jointly held by all authors listed on the article.
This page was created and is maintained by Victor Kasper.
Last updated: May 16, 2001